
Color Space Confusion
Aug 14, 2012
Author: Jeff Yurek
For many who are new to the world of display measurement, the prevalence of two distinct, but often-interchanged color spaces can be a source of confusion. Since my recent post about the color performance of Apple’s new iPad, a number of people have asked about this topic, so I thought it would be worth a closer look. In the world of displays and color images, there exists a variety of separate standards for mapping color, CIE 1931 and CIE 1976 being the most popular among them. Despite its age, CIE 1931, named for the year of its adoption, remains a well-worn and familiar shorthand throughout the display industry. As a marketer of high color gamut display components, I can tell you from firsthand experience that CIE 1931 is the primary language of our customers. When a customer tells me that their current display “can do 72% of NTSC,” they implicitly mean 72% of NTSC 1953 color gamut as mapped against CIE 1931.
However, from the SID International Committee for Display Metrology’s (ICDM) recent, authoritative Display Measurement Standard:
“…we strongly encourage people to abandon the use of the 1931 CIE color diagram for determining the color gamut… The 1976 CIE (u',v') color diagram should be used instead. Unfortunately, many continue to use the (x,y) chromaticity values and the 1931 diagram for gamut areas.”
So why are there two standards, and why are we trying to declare one of them obsolete? Let me explain.
What is a color space?
First, a little background on color spaces and how they work.
While there are a number of different types of color spaces, we are specifically interested in chromaticity diagrams, which only measure color quality, independent of other factors like luminance. A color space is a uniform representation of visible light. It maps the all of the colors visible to the human eye onto an x-y grid and assigns them measureable values. This allows us to make uniform measurements and comparisons between colors, and offers certainty that images look the same from display to display when used to create color gamut standards.
In 1931, the Commission internationale de l’éclairage or CIE (International Commission on Illumination in English) defined the most commonly used color space. Here’s a look at the anatomy of the CIE 1931 color space:

Anatomy of a CIE 1931 Chromaticity Diagram
What makes a good color space?
An effective color space should map with reasonable accuracy and consistancy to the human perception of color. Content creators want to be sure that the color they see on their display is the same color you see on your display.
This is where the CIE 1931 standard falls apart. Based on the work of David MacAdam in the 1940’s, we learn that the variance in percieved color, when mapped in the CIE 1931 color space, is not linear from color to color. In other words, if you show a group of people the same green, then map what they see against the CIE 1931 color space, they will report seeing a wide decprepancy of different hues of green. However, if you show the same group a blue image, there will be much more agreement on what color blue they are seeing. This uneveness creates problems when trying to make uniform measurements with CIE 1931.
The result of MacAdam’s work is visualized by the MacAdam Elipses. Each elipse represents the range of colors respondents reported seeing when shown a single color, which was the dot in the center of each elipse:

MacAdam Elipses on CIE 1931 with Adobe RGB 1998 color gamut
A better standard
It was not until 1976 that the CIE was able to settle on a significantly more linear color space. If we reproduce MacAdam’s work using the new standard, variations in percieve color are minimalized and the MacAdam’s Elipses mapped on a 1976 CIE diagram appear much more evenly sized and circular, as opposed to oblong. This makes color comparisons using CIE 1976 significantly more meaningful.
The difference of the CIE 1976 color space, particularly in blue and green, is immediately apparent. As an example, lets look at the color gamut measurements of the iPad 2 and new iPad we used in an earlier article. Both charts do a reasonably good job of conveying the new iPad’s increased gamut coverage at all three primaries. But, the 1976 chart captures the dramatic perceptual difference in blue (from aqua to deep blue) that you actually see when looking at the displays side by side:
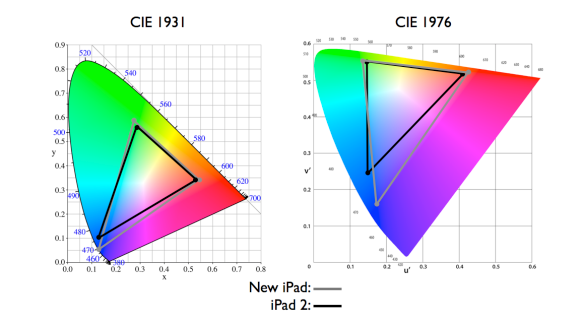
CIE 1976 vs 1931 Apple iPad color gamut measurement
The increased gamut of the new iPad is worth testing. Next time you find yourself in an Apple store, grab an iPad 2, hold it alongside a new iPad, Google up a color bar image and see the difference for yourself.
So, why do we still use CIE 1931 at all? The only real answer is that old habits die hard. The industry has relied on CIE 1931 since its inception, and change is coming slowly.
Fortunately, CIE 1931’s grip is loosening over time. The ICDM’s new measurement standard should eventually force all remaining stragglers to switch over to the more accurate 1976 standard. Until then, you can familiarize yourself with a decent color space conversion calculator, such as the handy converter we built just for this purpose:

xls